US 2020 Presidential Election PredictionsThis is the only site with all 2020 US Election Predictions
|
Non-Polling Based Methods
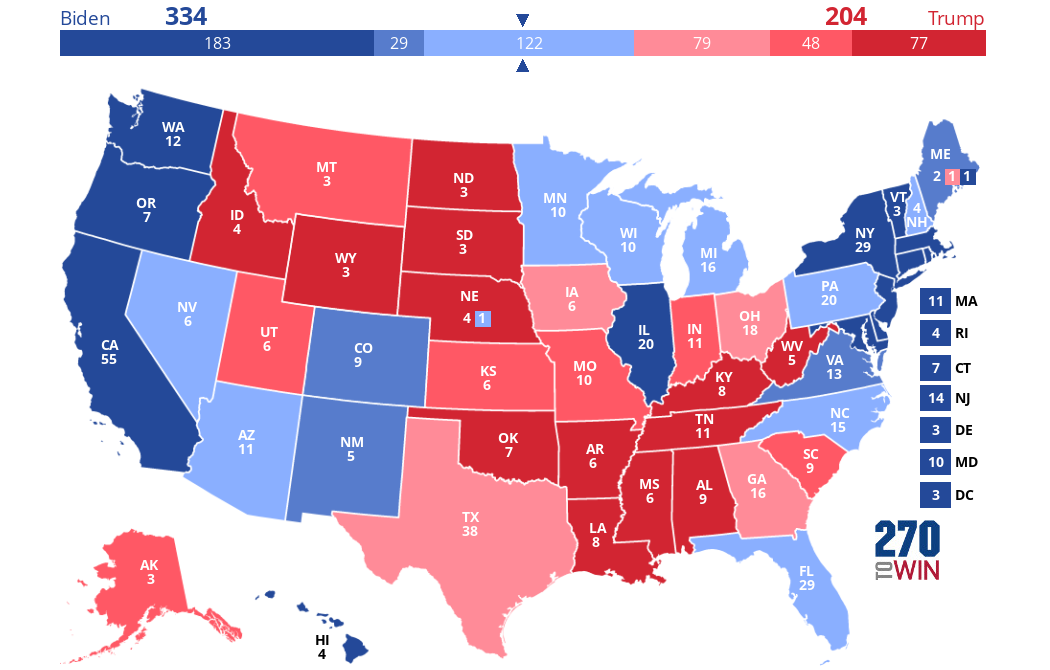
Consensus Model with 334 Electoral Votes
 Click the map to create your own at
Of the 19 model results shown below, there are 13 models predicting Joe Biden will be the next President and 6 models predicting Donald Trump will win re-election. Of the 13 model predicting Biden, the average electoral votes = 333. The map above is very close with 334 EV's.
I am very appreciative of the studies posted on the Cambridge University website for the American Political Science and Politics Association (APSA). Of the 19 reports on studies shown below, there are 11 from the symposium. Click on this link for their website: APSA website
A more appropriate title for this page could have been, "Non-Polling Based Methods and All Models presented at the APSA Symposium" because a number of the presentations used statewide polling surveys. For instance, Erikson and Wlezien, "Forecasting the 2020 Presidential Election: Leading Economic Indicators, Polls and the Vote" and Murr, "Citizen Forecasting 2020: A State by State Experiment" used surveys, albeit different surveys, and they predict quite different outcomes to the elections.
We are grateful to Dr. Jared Farley an associate professor of political science at the New Mexico Military Institute in Roswell, NM, who provided links to Alan Abramowitz model, an update by Don Luskin and a recent posting by Dr. Litchman. More recently, he sent us links to the Lewis-Beck and Tien models, the Political Economic Models from Dr. Campbell. and the APSA Symposium on the 2020 election predictions. We really appreciate your help.
Nothing is quite pure. Polling based forecasters do not restrict themselves to strictly the polls, and use other data such as demographic or historical data, with the statistical tools such as regression, similar to the quantitative models. The fivethirtyeight and economist forecasts include historical voting patterns in their predictions. So, we have some hybidizing going on - and that's probably for the best.
It isn't enough to show that the developed model is great for predicting past elections. One must decide in the case of the 2020 elections, how to handle the situation when the economic variables go haywire. I think the video clip I've included on Don Luskin's model demonstrate this problem.
Dr. Ray Fair of Yale University is likely considered the dean of the quantitative approach. He observed how good economic conditions correlate with re-election of an incumbent candidate or party. He was able to use econometric modeling to forecast the economic conditions likely to be present around election time to provide a more realistic prediction. Of course, forecasting depends on establishing trends in a fairly stable economic environment. Pandemics are not particularly helpful to prognostications. I did not include Dr. Fair's website in the table below, as he writes, "I did not make an economic forecast with my US model this time because the model has nothing to say about the effects of pandemics" and places a question mark in the column for the calculated percent popular vote. He lets the user decide how to predict the election. See Dr. Fair 2020 election forecast website.
I did not know how to classify Dr. Litchman and his 13 keys to the White House. He begins with the premise of many of his quantitative colleagues, that the presidency is mostly for the incumbent to lose. Trump will either succeed to be re-elected or fail depending on 13 true and false questions. In Dr. Litchman's evaluation, Trump scores 7 false answer, which means Biden is the likely winner of the election.
My comments on the studies are provided after the results. I invite comments, particularly to the contrary to what I've written.
A. Forecasts predicting Biden to Win:
| Winning Party | EV | % PV | Level | Notes | |
| Moody's Model 1: Average Dem turnout (Base Case) | Biden | 279 | State | Prior forecast (9/19) had Trump as the winner in tight race. The July 2020 forecast factored in the economic downturn. See Oct 27 Update and Webinar | |
| Skyler Dale, Medium.com | Biden | 279 | State | The key states Dale identified 10 months ago are still valid. Excellent pre-Covid and impeachment paper. | |
| Enns and Lagodny, Presidential Approval/ State Economy Model, Cornell University* | Biden | 290 | 54.5% | State | Study generated probability distribution for % popular vote each state, then used simulation to identify EV, % PV and Pwin. Pwin is reported to be 60%. |
| Gruca and Rietz, Iowa Electronic Markets * | Biden | 51.6% | National | Iowa Electronic Markets trades in futures contracts on vote share of Rep and Dem candidates. As of Aug 26, 69% chance Biden wins popular vote based on IEM. I will add an additional note on this paper. Very interesting approach. | |
| Political Economic Model, Dr. Jim Campbell, University of Buffalo, New York | Biden | 50.5% | National | Regression based with voter preference ratings. Predicts an extremely close race. No specific EV estimate given. | |
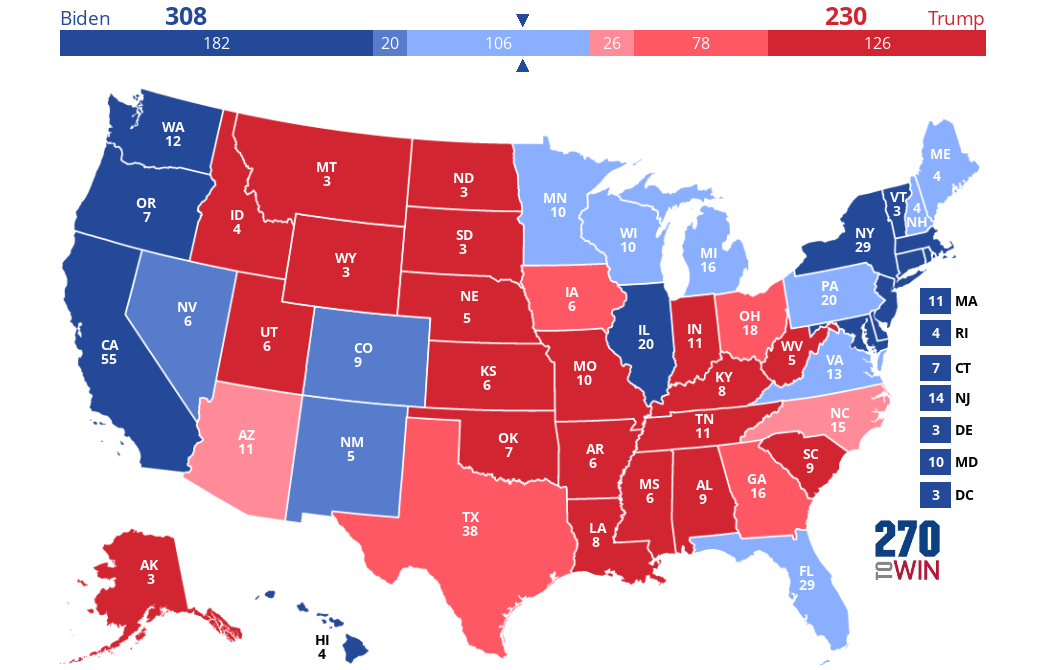
| Bruno Jérôme et al, Tough Victory for Biden, University of Paris, Montreal University* | Biden | 308 | 51.7% | State | Appendix M provides full state-by-state forecast. Model parameters were adjusted and variables added after 2016 election. |
| Alan Abramowitz U of Virginia * Paper | Biden | 319 | National | Linear regression with approval rating. Includes only re-election races. Estimates Pwin = 83% for Biden based on regression SE. | |
| Polly Vote Macromedia University * Symposium Paper | Biden | 330 | 52.0% | National | Result of averaging several forecasting models. |
| Vinod Bakthavachalam, Medium.com | Biden | 346 | 54.0% | State | Excellent insight on the demographics which result in certain states being Republican or Democratics, or right in the middle. |
| Erikson and Wlerzien, Leading Economic Indicators, Columbia University* | Biden | 55.0% | National | Combines leading economic indicators and polling data to estimate the percent popular vote both before and after the convention. | |
| Desart, Long range state level forecast, Utah Valley Univ | Biden | 350 | 54.8% | State | Regression analysis, which considers voter share by state of prior election as one of its variable. Correctly predicted Trump would win in 2016, when most did not. |
| Moody's Model 2: High Dem turnout sensitivity case. | Biden | 352 | State | Sensitivity case to assess effect of turnout. Result in included in average. | |
| Lewis-Beck and Tien model, Univ of Iowa and Hunter College. * Symposium Paper | Biden | 470 | 56.7% | National | Pwin = 95%. Multiple regression, % GNP and approval rating as variable. This would be a huge victory for Biden. |
| Allan Litchman, 13 Keys to the White House | Biden | National | Concludes Biden will win based on 7 false answers to his checklist of 13 questions. | ||
| Average | 328 | 53.5% | Average was 333 EV 10/27, Moody's lower estimate to 297 EV's. |
* Presented at APSA Symposium
B. Forecast predicting Trump to win:(EV are with respect to Trump)
| EV | PV | Level | |||
| Moody's Model 3: High Rep turnout | Trump | 345 | State | "What if" case with high Rep turnout. Not included in EV average. | |
| Citizen Model, Murr and Lewis-Beck * | Trump | 357 | 50.4% | State | Linear Regression and survey based variable, asking which candidate will win in the state. |
| Primary Model Dr. Helmut Norpoth * | Trump | 362 | National | Predicts a 91% chance of Trump winning the election. | |
| Economic Pessimism and Political Punishment in 2020,Lockerbie, East Carolina University * | Trump | 55.2% | National | Regression model gives incumbent an edge, helped by a low level of pessimism for coming year, based on survey. Chance of Trump winning more than 50% of popular vote = 95%. | |
| Don Luskin Model, Trends Macrolytics | Trump | 447 | National | Model results over 6 months have shown extreme changes as the economy crashed and latest stimulus payments were made. | |
| Average (excludes Moody's) | 389 | 53.2% |
* Presented at APSA Symposium.
Links to Symposium papers as posted to the Cambridge University website, on behalf of the Political Science and Politics Association on October 15, 2020. These studies are from professors of political science, who specialize in quantitative analysis of presidential elections. I am extremely appreciative of the APSA allowing the public to view these studies until the end of November. This website respects copyrights and only links to the Cambridge website are provided. Free access ends on November 30, 2020.
| Comments on Quantitative Methods |
| Comments on Citizen Model (Oct 25, 2020) |
| Abramowitz equation: Could it be this simple? |
| Lichtman's 13 Keys to the White House |
| Moody's Analytics Forecasts |
| Primary Model |
| Comments on Don Luskin's Model (October 6, 2020) |
I am very receptive to include additional models, provided there is documentation to support the predicted results. Use the contact form to suggest other models or correct information provided on this page.
David Lord
Moody's Forecast July 2020 Model
Likely states = States with predicted voting margins < 10% , Lean states = State with voting margins < 5%