Election Forecast Ranker |
I'm here to remind you that Trump can still win, by Nate Silver 538 website. Nov 1, 2020 The State of the Presidential Race Heading into Election Day, by Skyler Dale Prior comments and tables are provided in the archive |
Which forecasters got the election results right?This new web page ranks the forecasts in how close they came to Joe Biden's expected win with 306 electoral votes. Review of Forecasts Forecasts are rated on the basis of electoral votes. Most forecasts were reasonably close to the anticipated 306 EV's and all predicted Biden would win. A set of 19 forecasts was compared to the state results, and every forecast had at least one incorrectly forecasted state. A penalty was added in the case of toss-ups, so those who made the hard decisions on states like Florida, Georgia, Arizona and Pennsylvania would be rewarded. Out of 20 forecasts, North Carolina and Florida won by Trump, were each misjudged in 12 out of 20 times, Georgia won by Biden was misjudged 9 out of 20 times and Arizona was misjudged 7 out of 20 times. See Table 2. There were many good judgements in these predictions. Let's not forget how narrow Biden's win was in Wisconsin with only 0.6% margin, yet every forecaster judged correctly it would go to Biden. The polling surveys missed how narrow a lead Biden would have in many key states. In Florida, the polling surveys, in general, indicated a very narrow win for Biden. They were wrong in 2016, and wrong again this election. A comparison of aggregate polling data and winning margins is provided at the end of this page. I consider all forecasts ranked from 1 (Sabato's Crystal Ball) to 18 (Plural Vote) in Table 2 to be first place winners. In fact, Plural Vote was closer to 306 EV's than Sabato's forecast, but lost points because Plural Vote predicted 4 states incorrectly, which netted out in the total, as the errors were both on Republican and Democratic wins. The second place winners (rank 19 and 20) predicted Texas would be won by Biden with 38 electoral votes. Texas is one of the swing states, which some forecasters tried to ignore by casting it aside as a toss-up state. They were not part of my list as any forecast with more than 40 electoral votes in the toss-up category was excluded. Had Texas been won by Biden, I have no doubt these two forecasters (Our Progress and Lean Tossup websites) would be at the top of the list. Some forecasts predicted Trump would win, or that Biden would win by a landslide (> 400 EV's), but did not go as far as develop an electoral map. As a result, I did not evaluate these forecasts. I did not make a comparison of the popular vote, other to note that Jim Campbell came the closest using a simple regression model. PollyVote has posted an excellent review. See link. Biden vote share is about 50.9%, which is below the share anticipated by simulation models. Polls also overestimated Biden's popular vote share. The APSA Symposium articles were a very important contribution, which goes well beyond just predicting our election. This is process of moving from numbers to insight to see what can be learned. APSA papers were presented from universities located in Germany, Canada, Australia and France. The Polly Vote group, part of Macromedia University in Munich, Germany, evaluated the US election using a variety of different methods. I note one paper in particular, by Dr. Keith Dowling from the Australian National University, entitled "Why Forecasting?: The Value of Forecasting in Political Science." Forecasting our presidential elections is a clear invitation to being wrong. He states that the fact that astronomers can't precisely predict where a meteorite might hit the earth does not diminish the discipline of astronomy. It is good to take a step back, and see that election forecasting has emerged as an multi-discipline and international effort. Data science and statistical analysis are not an added part of political science. As these studies show, one can't really say that election forecasting belongs to any one of these disciplines. It really is whatever works to make sense of the data. Part of this process is the art of selectivity - knowing what to include and exclude. And that's the way it should be in science! In developing this website, I am very indebted to 270 to Win, which not only makes all the electoral maps on this websites easy to link to without charge, but then continues to update them. I could never keep up with all of their maps. The cooperation is quite amazing. I've had contacts with other forecasters through email at a time when everyone (including myself) is scared that they will be barraged with spam. David Lord Updated Nov 14, 2020 Link to APSA Forecasts |
||||||||||||||
| Model | Winner | EV * | Model Category |
| Moody's Model 1: Average Dem turnout (Base Case) | Dem | 279 | Quantitative |
| Skyler Dale, Medium website | Dem | 279 | Quantitative |
| Enns and Lagodny, Presidential Approval/ State Economy Model, Cornell University | Dem | 290 | Quantitative |
| Predictit (Betting site) | Dem | 305 | Betting |
| Election Projection | Dem | 307 | Poll based |
| Bruno Jérôme et al, Tough Victory for Biden, University of Paris, Montreal University | Dem | 308 | Quantitative |
| Alan Abramowitz U of Virginia ** Paper | Dem | 319 | Quantitative/ National est |
| Inside Elections | Dem | 319 to 334 | Poll-based |
| Economist | Dem | 319 to 356 | Poll-based |
| Sabato's Crystal Ball | Dem | 321 | Poll-based |
| Polly Vote Macromedia University * Symposium Paper | Dem | 330 | Quant - Average of methods |
| Sim 538 | Dem | 334 | Poll Based |
| JHK Forecasts | Dem | 335 | Poll-based |
| Plural Vote | Dem | 341 | Poll-based |
| Princeton Election Consortium | Dem | 335 to 351 | Simulation/Poll-based |
| Fivethirtyeight Website | Dem | 349 | Simulation/Poll-based |
| Desart, Long range state level forecast, Utah Valley Univ | Dem | 350 | Quantitative |
| YouGov | Dem | 356 | Poll-based |
| Real Clear Politics (no toss-up map) | Dem | 357 | Poll-based |
| Electoral-vote | Dem | 356 to 374 | Poll-based |
| Lean Toss Up | Dem | 384 | Simulation/Poll-based |
| Our Progress | Dem | 389 | Poll-based |
| Lewis-Beck and Tien model, Univ of Iowa and Hunter College. ** | Dem | 470 | Quantitative |
| Citizen Model, Murr and Lewis-Beck | Rep | 357- Trump | Quantitative + Survey/National est |
| Primary Model Dr. Helmut Norpoth ** | Rep | 362- Trump | Quantitative/ National est |
| Don Luskin Model, Trends Macrolytics | Rep | 447 - Trump | Quantitative/ national est |
* Only forecasts with less than 40 or less toss-up are included in this table. The upper range of EV is based on the total EV's for one party plus all toss-up votes. ** This is a national forecast and no state wide comparisons can be made. Polling surveys of key states before the electionThe polling data come from Wikipedia, in the last poll aggregation prior to Nov 3. The three websites used different methods to combine poll surveys. Polls inherently have errors. However, in this case, the error was consistently to overestimate the percentage of the popular vote Biden would received. The polls picked the wrong candidate in FL, NC and ME-2. The exceptions were Minnesota and Georgia, which was close. Polls also consistently predicted Biden would win the popular vote, but by a larger margin than he did. It is well documented that the polls in the 2016 presidential election also overestimated Hillary Clinton's success in the key swing states as well. Obtaining a representative sample in these states can be difficult as a very significant percent of the electorate do not vote. The intent of polling organizations is to deliver as accurate forecasts as possible. In the future, we will post articles which help explain the consistent overestimation in the poll surveys, in both 2016 and 2020 elections. The table below is preliminary, and we are still cross checking the estimates. In states that Biden won, Real Clear method of aggregating polls came closer to winning margins than the other two websites. However, in predicting the margins in Iowa, Ohio and Texas, the other two websites did better. |
| States |
Real Clear Politics |
270 to win |
538 website |
Election Projected Winner |
Lead/Deficit for Biden | Polls underestimated or overestimated vote for Biden |
| Nevada (16) | 3.6 Biden | 5.0 Biden | 4.9 Biden | Biden | 2.5 | Overestimated |
| Minnesota, (10) | 4.3 Biden | 9.8 Biden | 9.3 Biden | Biden | 7.2 | Polls were close |
| Michigan, (16) | 5.1 Biden | 5.4 Biden | 8.1 Biden | Biden | 1.2 | Overestimated |
| Pennsylvania (20) | 4.3 Biden | 5.0 Biden | 5.1 Biden | Biden | 1.0 | Overestimated |
| Wisconsin (10) | 6.6 Biden | 8.0 Biden | 8.2 Biden | Biden | 0.6 | Overestimated |
| Arizona (11) | 1.0 Biden | 3.4 Biden | 2.9 Biden | Biden | 0.3 | Overestimated |
| Nebraska CD2 (1) | NA | 3.0 Biden | 4.0 Biden | Biden | +7.0 | Underestimated |
| Florida (29) | 1.0 Biden | 2.7 Biden | 2.3 Biden | Trump | -3.4 | Overestimated - Trump won |
| North Carolina (15) | 0.6 Trump | 0.2 Biden | 1.8 Biden | Trump | -1.3 | Overestimated - Trump won |
| Georgia (16) | 0.4 Biden | 0.2 Biden | 1.1 Biden | Biden | 0.3 | Polls were close |
| Maine CD2 (1) | NA | 1.2 Biden | 3.2 Biden | Trump | -8.0 | Overestimated |
| Iowa (6) | 0.7 Trump | 2.0 Trump | 1.4 Trump | Trump | -8.3 | Overestimated |
| Ohio (18) | 0.2 Trump | 0.8 Trump | 0.4 Trump | Trump | -8.1 | Overestimated |
| Texas (38) | 1.2 Trump | 1.3 Trump | 1.0 Trump | Trump | -5.7 | Overestimated |
SIM 538 Election Forecast
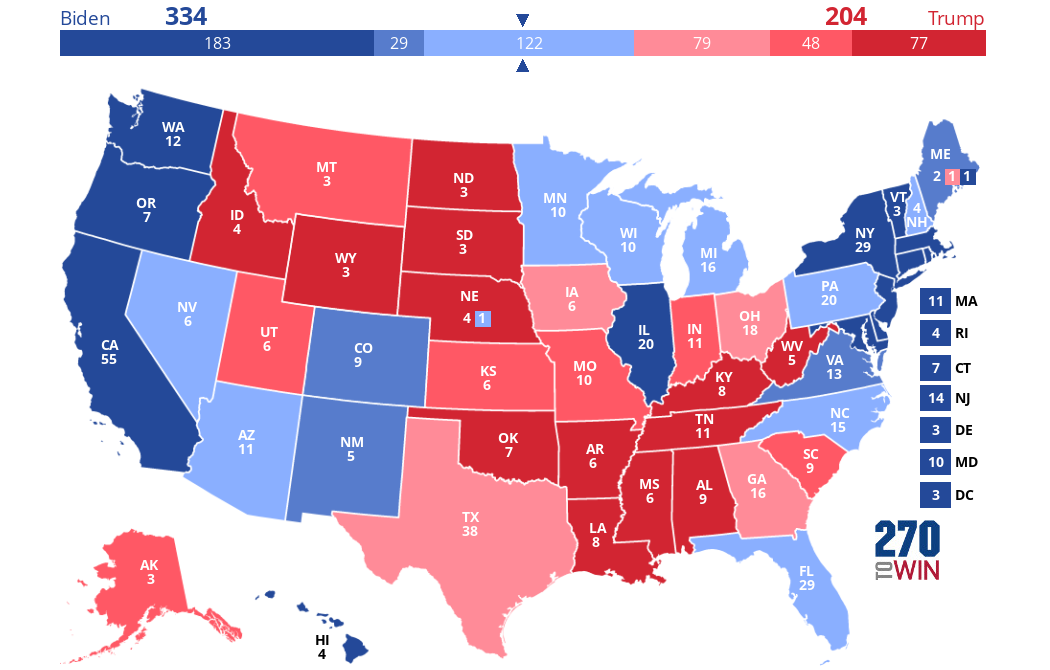
 Click the map to create your own at 270toWin.com